

Answer Type: Table

Destinations of Anthropology Graduates
Eli

Destinations of Anthropology Graduates

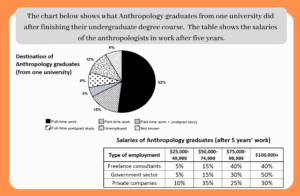
The graphics show the destinations of Anthropology graduates from one university after completing their undergraduate degree, as well as the salaries earned by those in work after five years. Over half of graduates (52%) entered full-time employment, making it the most common outcome. Smaller proportions worked part-time (15%), pursued full-time postgraduate study (8%), combined part-time work with postgraduate study (5%), were unemployed (12%), or had unknown destinations (8%). The salary table indicates that government sector employees were the highest earners after five years, with 50% receiving over $100,000. Freelance consultants also performed well, with 80% earning at least $75,000, while private company employees were more evenly distributed across the salary bands, with 30% earning more than $100,000.
Read More »
Police Budget
Eli

Police Budget

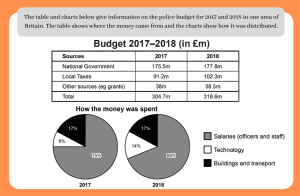
The graphics show the sources and allocation of a police budget in one area of Britain in 2017 and 2018. Overall, the total budget increased from £304.7 million in 2017 to £318.6 million in 2018. In both years, the national government was the largest source of funding, followed by local taxes and other sources such as grants. Local tax revenue experienced the largest increase, rising from £91.2 million to £102.3 million. In terms of expenditure, salaries for officers and staff accounted for the majority of spending, although their share fell from 75% in 2017 to 69% in 2018. By contrast, spending on technology increased from 8% to 14%, while the proportion allocated to buildings and transport remained unchanged at 17% in both years.

Read More »
Eli

Admission to Entertainment Venues

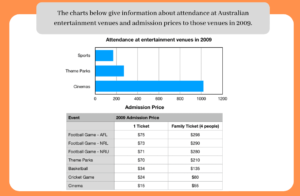
The graphics compare attendance at three types of entertainment venues in Australia in 2009 and the admission prices charged for various events. Overall, cinemas were by far the most popular venue, attracting just over 1,000 attendees, compared with around 280 for theme parks and approximately 170 for sports events. In terms of ticket prices, football matches were the most expensive entertainment option, with individual tickets costing between $71 and $75 and family tickets ranging from $280 to $298. Theme parks also charged relatively high prices, at $70 for a single ticket and $210 for a family pass. By contrast, cinemas had the lowest admission fees, costing only $15 per person and $55 for a family ticket, which may help explain their substantially higher attendance figures. Cricket and basketball occupied the middle range in terms of pricing.

Read More »
Eli

Survey Of Soft Drinks

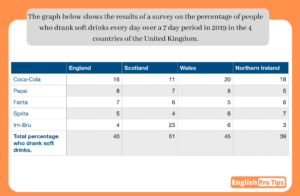
The table shows the results of a survey on the percentage of people who drank soft drinks every day over a seven-day period in England, Scotland, Wales and Northern Ireland in 2019. Overall, Scotland recorded the highest proportion of daily soft drink consumers at 51%, while Northern Ireland had the lowest figure at 39%. Coca-Cola was the most popular soft drink in England (16%), Wales (20%) and Northern Ireland (18%), whereas Irn-Bru dominated in Scotland, where 23% of people drank it daily. Pepsi consumption was relatively similar across the four countries, ranging from 5% in Northern Ireland to 8% in England and Wales. Fanta and Sprite were generally less popular, with figures mostly between 4% and 7%. Irn-Bru showed the greatest variation, accounting for only 3–6% of daily consumption outside Scotland.

Read More »
Eli

Population Growth

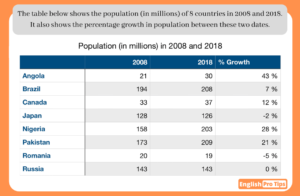
The table compares the populations of eight countries in 2008 and 2018 and shows the percentage change over the ten-year period. Overall, most countries experienced population growth, with Angola recording the fastest increase at 43%. In contrast, Japan and Romania were the only countries to see their populations decline, while Russia’s population remained unchanged.

In 2008, Brazil had the largest population at 194 million, followed by Pakistan (173 million) and Nigeria (158 million). By 2018, Pakistan had become the most populous country in the table with 209 million people, narrowly ahead of Brazil (208 million) and Nigeria (203 million). Nigeria recorded a substantial increase of 45 million people, while Pakistan grew by 36 million and Brazil by 14 million.

Among the smaller countries, Angola’s population rose significantly from 21 million to 30 million, representing the highest growth rate. Canada’s population increased modestly from 33 million to 37 million. By contrast, Japan’s population fell from 128 million to 126 million, while Romania declined from 20 million to 19 million. Russia remained stable at 143 million throughout the period.

Read More »
Eli

Income in European Countries

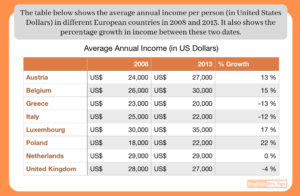
The table compares average annual income per person in eight European countries in 2008 and 2013, as well as the percentage change over the five-year period.

Overall, incomes increased in most countries, with Poland experiencing the fastest growth. In contrast, Greece and Italy recorded significant declines, while income in the Netherlands remained unchanged. Luxembourg had the highest average income in both years, whereas Poland had the lowest income in 2008.

In 2008, Luxembourg had the highest average annual income at US$30,000, followed by the Netherlands (US$29,000) and the United Kingdom (US$28,000). Poland had the lowest figure at US$18,000. By 2013, Luxembourg remained the highest-income country, with average earnings rising to US$35,000. Belgium also saw strong growth, increasing from US$26,000 to US$30,000.

Poland experienced the largest percentage increase, with income rising by 22% from US$18,000 to US$22,000. Luxembourg and Belgium also recorded notable growth of 17% and 15% respectively. Austria’s income increased moderately by 13%, from US$24,000 to US$27,000.

By contrast, Greece and Italy were the only countries to experience double-digit declines. Average income in Greece fell from US$23,000 to US$20,000, a decrease of 13%, while Italy’s figure dropped by 12%, from US$25,000 to US$22,000. Income in the United Kingdom declined slightly by 4%, from US$28,000 to US$27,000, whereas the Netherlands remained stable at US$29,000 throughout the period.

Read More »

Thank you for submitting your answer

Congratulations, your answer has been posted!

Close this popup to continue with the course

Thank you!

Let’s arrange a time.

Click here to arrange a time

Thank you for submitting your answer

Congratulations, your answer has been posted!

Click here to See your answer